
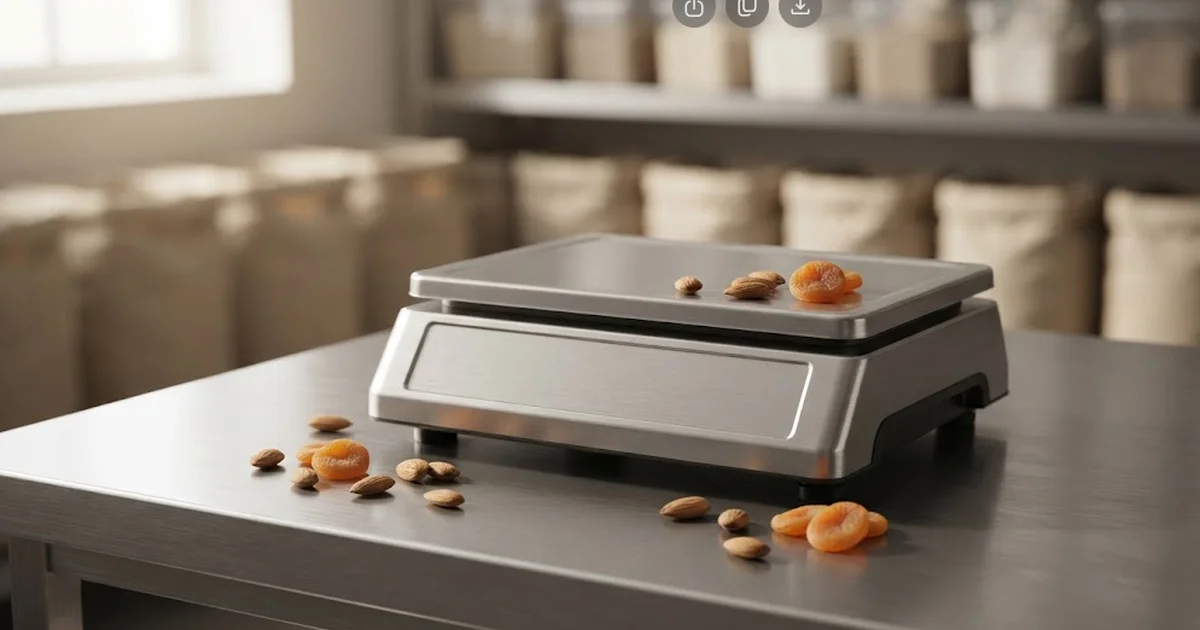
Démarque et casse : mesurer les pertes d'un rayon vrac
Breakage, dehydration, sampling, weighing errors: the Palimex method to measure each bulk B2B loss item and adjust your pricing without guesswork.
In a bulk aisle, the difference between theoretical stock and actual sales is never explained by a single cause. Breakage, dehydration, sampling, weighing errors, and downgraded products combine and mask each other if you rely solely on a month-end global variance. For a wholesaler or professional point of sale operating with minimum packaging, isolating each item becomes the only way to correct the selling price without targeting the wrong issue.
Bulk Aisle: Where Do Losses Actually Come From?
Before attempting to quantify shrinkage, you must distinguish the mechanisms that produce it. Each has a different cause, timeline, and solution—confusing them means treating all symptoms with the same remedy.
- Breakage: Dried fruits crushed during handling, overturned bins, bottom-of-container bags damaged by the weight of stock above.
- Dehydration: Weight loss through natural evaporation in soft or dehydrated fruits exposed to ambient air, particularly noticeable in dried apricots, figs, or dates.
- Sampling: Samples given to a professional client for testing, trade show tastings, unrecorded staff snacks.
- Weighing Errors: Tare not reset to zero, systematic rounding in the customer’s favour, scales not calibrated for several weeks.
- Downgraded Products: Batch that shifts from a higher to a lower grade after quality control, or short-dated stock sold urgently at a reduced price.
Isolate Each Loss Item Instead of Thinking Globally
A 3 kg stock variance on a 50 kg batch tells you nothing on its own. You need to know whether it stems from a dropped container, a hot week that dried the product, or consistently generous weighing at the checkout. The table below provides a separate measurement grid, item by item, applicable as a weekly routine.
| Loss Item | Typical Origin | Measurement Method | Control Frequency |
|---|---|---|---|
| Breakage | Handling, bin drop, rotation weight | Weigh debris/rejects separately at each restocking | At each delivery or bin rotation |
| Dehydration | Air exposure, ambient humidity, repeated container opening | Weigh a sealed control batch vs. an identical exposed batch over 7 days | Monthly, by product family |
| Sampling | Client samples, tastings, supplier tests | Sampling log with weight and reason recorded for each removal | Daily, weekly cumulative |
| Weighing Errors | Tare, rounding, uncalibrated scales | Compare invoiced weight vs. actual weight on a sample of receipts | Fortnightly |
| Downgraded Products | Quality control, non-compliant grade, short-dated stock | Downgrading register with quantity, reason, and destination (waste or discounted sale) | At each reception check or internal audit |
Correctly reading a technical data sheet helps distinguish a compliant batch from one to downgrade upon receipt, before it even reaches the aisle. Our guide on how to read a technical data sheet and understand grades and sizes details the criteria to check before validating a delivery.
Implement a Simple Weighing and Control Protocol
The method doesn’t need to be sophisticated to be reliable. It must above all be repeated identically, week after week, so that observed variances are comparable.
- Weigh the initial stock upon receipt, batch by batch, and record the weight on the delivery note.
- Calibrate the countertop scale once a week with a known test weight.
- Record each sample (test sample, tasting, observed breakage) in a dedicated log, with weight and reason.
- Weigh the residual stock at the end of rotation, before restocking.
- Compare the theoretical weight sold (sum of receipts) to the weight actually removed from the bin.
- Allocate the resulting variance among the identified items using records from the previous steps.
For bulk almonds, which are particularly prone to breakage during transfer, this protocol often reveals that a significant portion of the variance stems from the container rather than the product itself. The almond range offered by Palimex comes in several formats specifically to limit repeated handling in the aisle.
Reflect Shrinkage in the Selling Price Without Distorting the Margin
Once each item is measured separately, it becomes possible to reflect the actual loss in the selling price, rather than applying a flat markup that penalises products less prone to shrinkage.
At Palimex, we advise our professional clients never to average shrinkage across the entire bulk catalogue. A dried fruit highly susceptible to dehydration and a stable candied fruit do not share the same loss reality: treating them with the same coefficient means overcharging one and undercovering the other. Measure, isolate, then integrate the rate specific to each SKU into its margin coefficient.
Here is a deliberately fictional example to illustrate the reflection logic—this is in no way an observed rate or an average to apply as-is:
| Measured Loss Item | Variance Observed on the Control Batch | Impact on the Real Cost per kg | Suggested Selling Price Adjustment |
|---|---|---|---|
| Dehydration | Weight loss measured over 7 days of exposure | Purchase cost spread over a reduced sellable weight | Integrate the average measured variance into the coefficient, revised quarterly |
| Breakage | Debris removed at each rotation, weighed separately | Reduced sellable volume without loss of purchase cost | Adjust downward if sturdier packaging reduces breakage |
| Downgraded Products | Quantity shifted to a lower grade or discounted sale | Reduced margin on the downgraded quantity only | Create a dedicated discounted price rather than diluting the loss across the entire batch |
Traceability, Batches, and Shelf Life: The Link Between Quality and Shrinkage
Shrinkage is not just a matter of weight: it is also a matter of traceability. A batch poorly identified upon receipt, without a batch number or clearly marked shelf life on the bulk bin, complicates quality control and delays the detection of a product to downgrade before it becomes unsellable.
- Systematically record the batch number and shelf life on the bulk bin label, not just on the original carton.
- Physically separate new arrivals from batches in rotation to prevent mixing that would make tracking impossible.
- Document each downgrading in the HACCP register, with reason and quantity, to maintain a usable history from one quarter to the next.
This documentary rigour aligns with best practices for storage detailed in our article on storing dried fruits and shelf life in stock, which helps anticipate products most exposed to dehydration before they generate unmeasured loss.
Real-World Case by Product Family: Dried Fruits, Olives, Soft Fruits
Each bulk product family has a dominant loss profile, allowing you to prioritise controls where the stakes are real rather than monitoring everything equally.
For olives in buckets, breakage due to container weight and repeated handling during bin filling remains the most frequent item; the 2 kg olive bucket range limits this risk by reducing the number of transfers needed compared to larger packaging. For dried apricots, however, dehydration and grade downgrading dominate: a batch of N1 dried apricot in 5 kg may see part of its weight reclassified into a lower category after a grade check, which must be recorded as a downgrade and not confused with weight loss.
Common Mistakes to Avoid in Bulk Shrinkage Tracking
Some well-intentioned practices distort measurement more than they improve it. Identifying them helps avoid building a biased tracking system from the start.
- Applying a single shrinkage coefficient to the entire bulk catalogue, without distinguishing product families.
- Weighing stock only at month-end, which prevents attributing the variance to a specific item.
- Treating a client sample as a "normal" loss without recording it, which artificially inflates the variance attributed to breakage or weighing.
- Failing to recalibrate scales after moving or jarring them, introducing a systematic bias that is difficult to detect later.
Summary: A Method Rather Than a Figure to Copy
Bulk aisle shrinkage is never just a single percentage. It is built item by item: breakage measured separately at each rotation, dehydration tracked on a control batch, samples logged, weighings checked, downgrades recorded in a separate register. It is this breakdown—and not an average rate borrowed from elsewhere—that allows you to adjust a fair selling price and preserve margins without penalising the least exposed products. To delve deeper into grades and sizes that determine some downgrades, consult our guide on how to read a product technical data sheet.
For further insights into traceability and food waste reduction in the professional supply chain, the ADEME documentation on combating food waste provides additional methodological benchmarks useful for wholesale professionals.
Further reading
Frequently asked questions
Everything you need to know about this topic.
A question?
Get in touch directly.

Marketing & Communications Manager — Palimex / Meyva
As Marketing & Communications Manager at Palimex / Meyva, Aude Moyne leads the company's communications and digital marketing strategy: editorial content, email campaigns and the promotion of its product ranges. Her experience at Palimex, a specialist in dried fruit, nuts, olives and spices for professionals, has given her in-depth knowledge of the products, their origins and uses, and the expectations of food-industry professionals. The blog articles are written or supervised by her, in collaboration with Palimex's sales and product teams whenever a topic calls for specific expertise.
Our advice related to Pro-tips
 pro-tips
Lot Inspection: How to Build a Representative Sample
Receiving a pallet: how many samples, how to distribute them, and which checkpoints to use for inspecting a lot of nuts, spices, or olives without opening everything.
 pro-tips
Cycle Counting: Counting Without Halting B2B Operations
Cycle counting method for grocery and foodservice: segmentation by product family, frequency based on turnover, acceptable discrepancies, and handling recurring variances.
 pro-tips
Safety Stock and Reorder Point in Foodservice Wholesale
Safety stock and reorder point in foodservice wholesale: the formula, a step-by-step numerical example, and how packaging impacts the calculation.